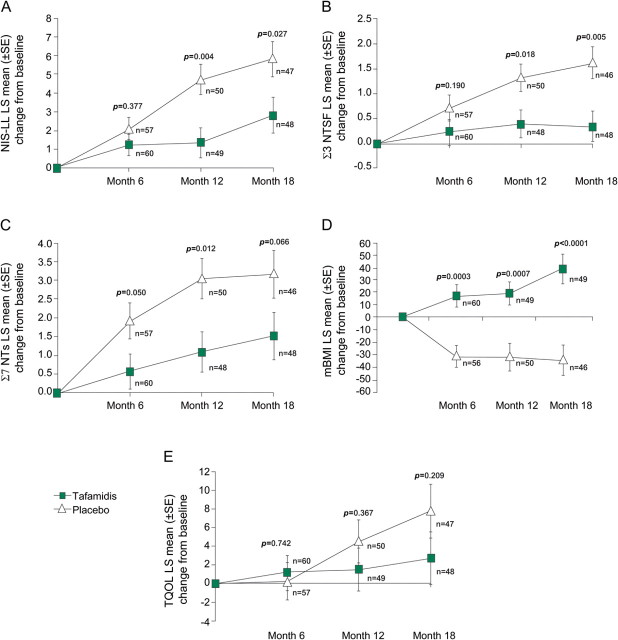
Figure 3. Secondary endpoints in the ITT population.
This figure shows the LS Mean (±SE) changes from baseline at months 6, 12, and 18 for the NIS-LL (A), small- (Σ3 NTSF nds) and large- (Σ7 NTs nds) nerve fiber function (B and C, respectively), mBMI (D), and TQOL (E). Analyses were performed using observed cases. ITT = intent-to-treat; LS Mean = least-squares mean; mBMI = modified body mass index; NIS-LL = Neuropathy Impairment Score–Lower Limbs; TQOL = Norfolk Quality of Life–Diabetic Neuropathy total score; Σ7 NTs nds = summated 7 nerve tests normal deviates; Σ3 NTSF nds = summated 3 nerve tests small-fiber normal deviates.

