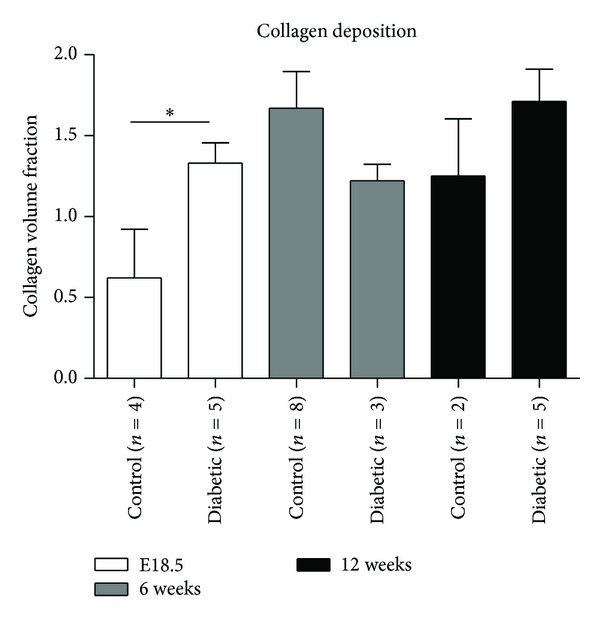
Figure 4.

Comparison of the degree of collagen deposition. Cardiac tissues derived from offspring of control and diabetic groups from E18.5 (white bars), 6 weeks (grey bars), and 12 weeks (bars) of age were stained with Picrosirius red to assess the extent of collagen deposition. Slides were digitally scanned and a positive pixel count algorithm was used to automatically quantify the area occupied by the dark pink stain colors representing collagen. The collagen volume fraction was calculated and is presented. *P < 0.05.
