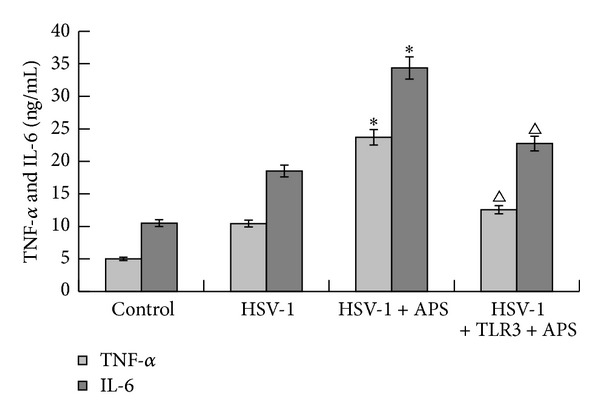
Figure 3.

Concentration of TNF-α and IL-6 (ng mL−1) in cell culture medium detected by ELISA. *P < 0.01 versus the HSV-1 group. Δ P < 0.05 versus the TLR3 antibody + HSV-1 + APS group. n = 3.

Concentration of TNF-α and IL-6 (ng mL−1) in cell culture medium detected by ELISA. *P < 0.01 versus the HSV-1 group. Δ P < 0.05 versus the TLR3 antibody + HSV-1 + APS group. n = 3.