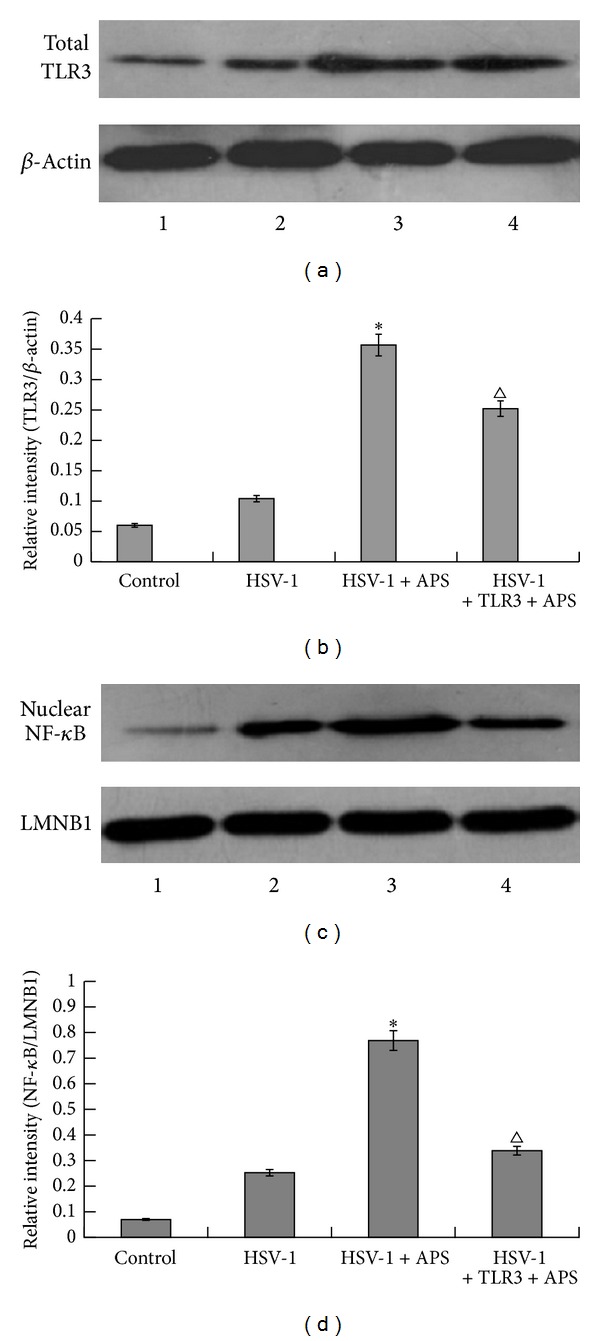
Figure 4.

Western blot analysis of expression levels of total TLR3 and nuclear NF-κB (activated NF-κB). (a) Expression levels of total TLR3 protein in blank control group, HSV-1 group, HSV-1 + APS group, and TLR3 antibody + HSV-1 + APS group. β-Actin was used as a loading control. (b) The relative intensity of total TLR3 protein as analyzed by Western blot. (c) Expression levels of nuclear NF-κB protein (activated NF-κB) in blank control group, HSV-1 group, HSV-1 + APS group, and TLR3 antibody + HSV-1 + APS group. LMNB1 was used as a loading control. (d) The relative intensity of nuclear NF-κB protein (activated NF-κB) as analyzed by Western blot. *P < 0.01 versus the HSV-1 group. Δ P < 0.05 versus the TLR3 antibody + HSV-1 + APS group. The results of Western blot were from a representative of at least three repeated experiments. n = 3.
