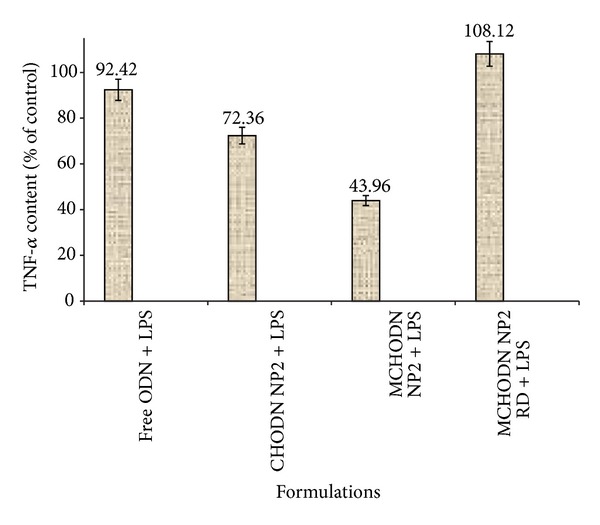
Figure 14.

TNF-α expression profile of transfected Raw 264.7 cells with free ODN and MCHODN NP2 after stimulation of cells with 100 ng/mL LPS (n = 3), # Control cells treated with PBS + LP.

TNF-α expression profile of transfected Raw 264.7 cells with free ODN and MCHODN NP2 after stimulation of cells with 100 ng/mL LPS (n = 3), # Control cells treated with PBS + LP.