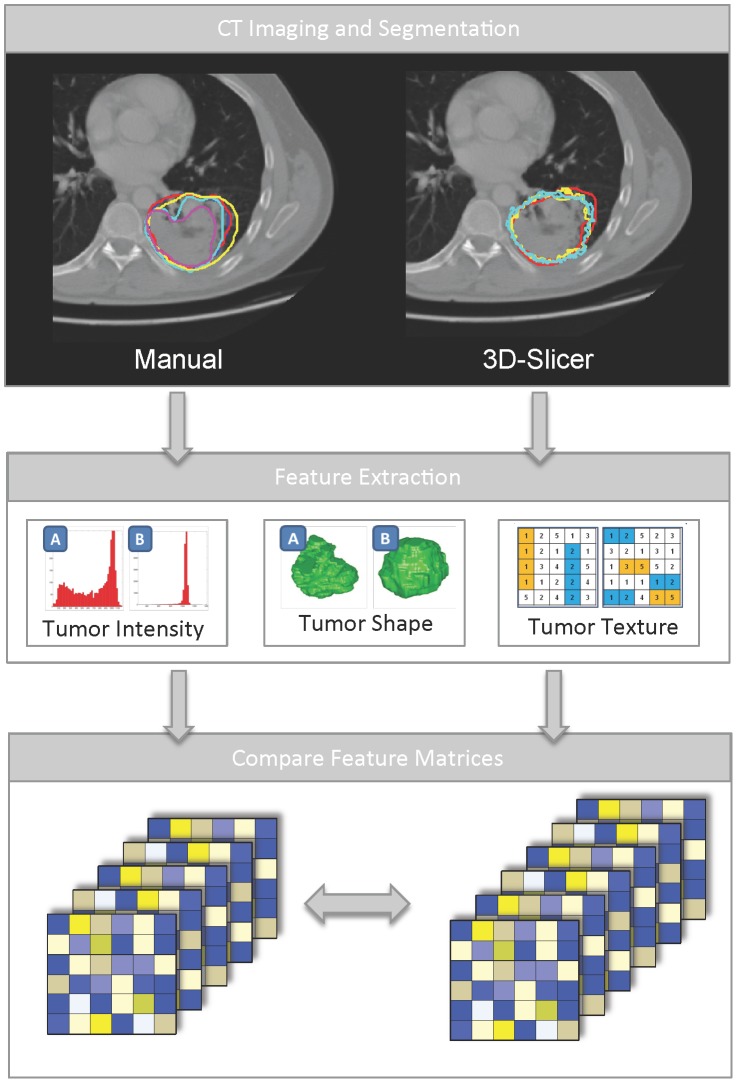
Figure 1. Schematic diagram depicting the overview of the analysis.
A: First, we performed five manual delineations and six 3D-Slicer segmentations (three observers twice) on twenty lung tumors. B: Second, fifty-six radiomic features quantifying tumor intensity, texture and shape were extracted from these segmentations. C: Third, the resulting feature matrices were compared for robustness of the feature values.

