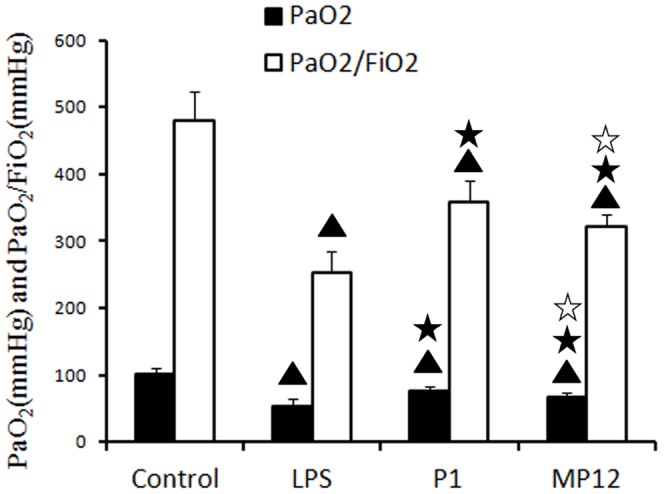
Figure 6. Effects of P1 and MP12 on LPS rat arterial blood gas analysis.

PaO2 and PaO2/FiO2 decreased significantly in the LPS group compared to the normal group; with LPS, these were <60 mmHg and <300 mmHg, respectively. After P1 and MP12 treatments, both PaO2 and PaO2/FiO2 improved; these were >60 mmHg and >300 mmHg, respectively. The outcome was better in the P1 group compared to the MP12 group. ▴ compared with the control group: P<0.01, ★ compared with the LPS group: P<0.01; ☆ compared with the P1 group: P<0.05.
