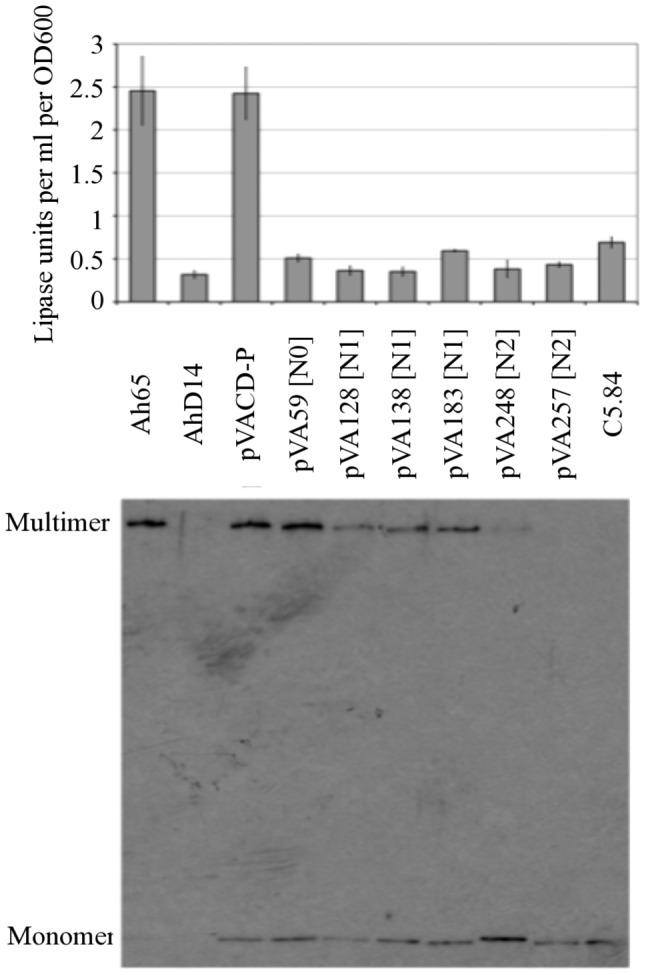
Figure 3. Lipase secretion (top) and secretin assembly (bottom) by the two codon insertion mutants.

Data presented are the average lipase activity of three independent cell cultures compared to the wild-type strain. Error bars indicate the standard deviation. Assembly of the secretin was analyzed as described in the materials and methods. The exeAB − strain C5.84 was used as a negative control. The ExeD multimers and monomers are indicated.
