
Figure 1.
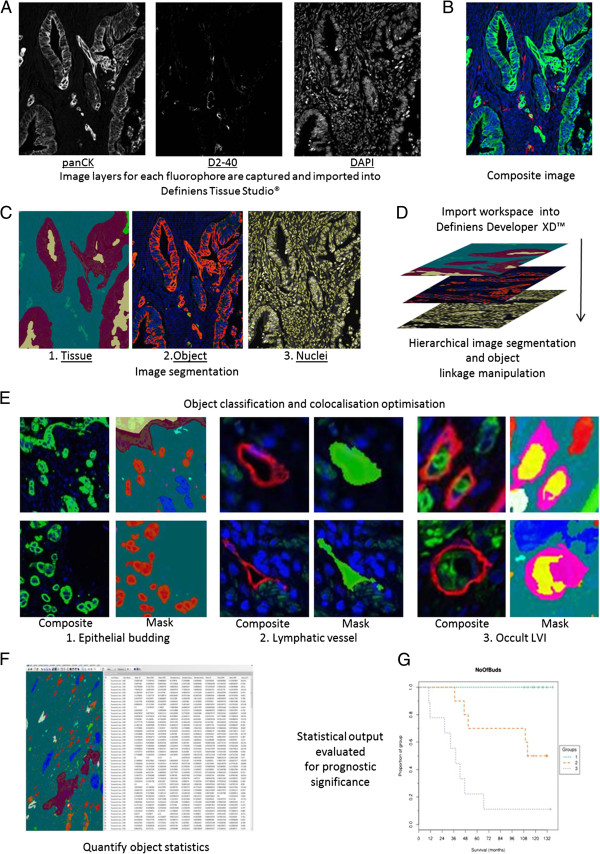
Image analysis pipeline for histopathological feature quantification. A) Images for each wavelength are acquired and digitised prior to being imported into Definiens Tissue Studio®. B) A Composite image is created within the software; green (panCK), red (D2-40) & blue (DAPI). C) 1. Tissue level segmentation: Tissue is segmented prior to image based machine learning through Definiens Composer technology; blue (stroma), maroon (tumour), mustard (lumen/necrosis). C) 2. Object level segmentation: PanCK (Marker 1: red) and D2-40 (Marker 2: green) staining above set thresholds are segmented. C) 3. Nucleus level segmentation: DAPI channel is used to segment nuclei (yellow). D) Analysis workspace is imported into Defineins Developer™ for hierarchical layer manipulation and false positive marker identification. E) Object classification and colocalisation optimisation. 1. Markers 1 in stroma (blue) classified as tumour bud (red; 1–5 nuclei), bud with debris nucleus (light blue; debris nuclei associated), irrelevant marker (pink; no associated nucleus) and large bud (dark blue; >5 nuclei). 2. Lymphatic vessels and lumen are segmented and classified (green). 3. Colocalisation of tumour buds and lymphatic vessels are classified (yellow; LVI), (pink; vessel border to LVI). F. Relevant objects are quantified and exported from the software; Figure 1F is representative of example data acquired from image object analysis. G. Prognostic results are calculated from the exported analysis data which was acquired from image object quantification.