
Figure 3.
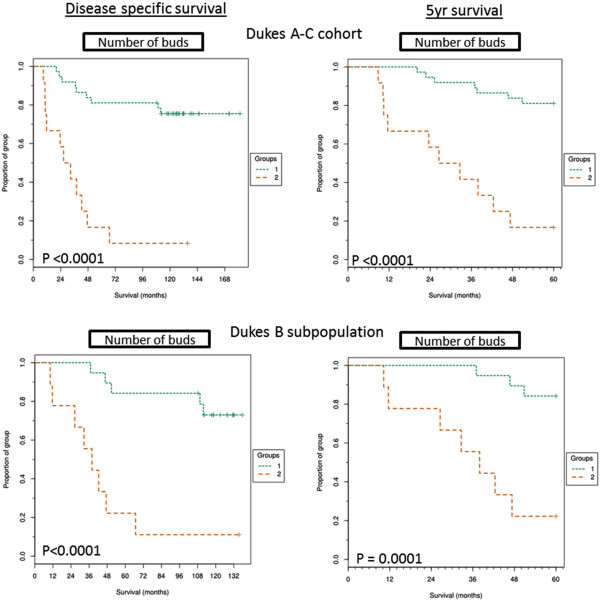
Kaplan-Meier curves for tumour budding. Kaplan-Meier curves showing full follow up disease specific and 5 year disease specific survival of above cut-off TB group (>287 buds, group 2) and below cut-off TB group (<287 buds, group 1) within the full Dukes A-C cohort and the Dukes B subpopulation and across disease specific survival or 5 year survival. Significance shown by P value calculated from mantel-cox analysis and FDR corrected.