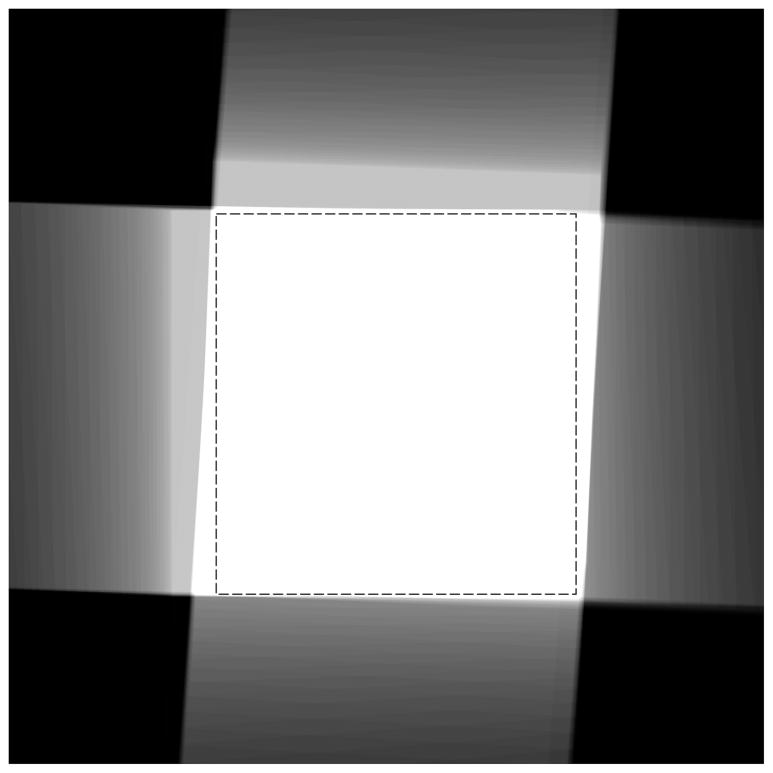
Figure 2.
Maximal usable area displayed in the common coordinate frame of the specimen. Contributions from the selected region of interest for each tilt series member are superimposed. The area where all contributions overlap appears white. Various grey levels indicate contributions from fewer members, and black means no contribution. The inscribed dashed rectangle shows the largest area which can be selected relative to the pixel raster and be used for area matching. For display purposes, the total area of the image computed and shown in the figure has been chosen to be about twice the linear dimensions of the usable area.

