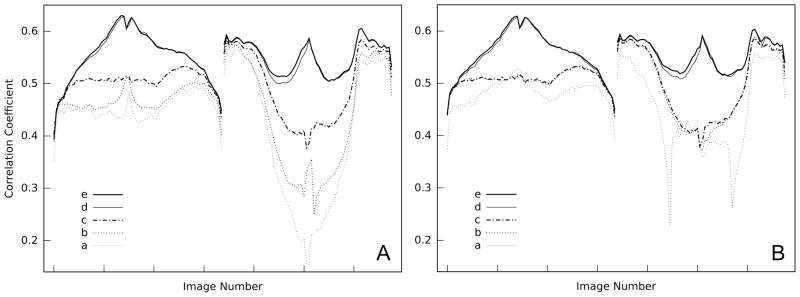
Figure 3.

Alignment quality. (A) All images of the first tilt series were aligned first, followed by the images of the second one. (B) All images are aligned strictly in the order of ascending magnitude of the tilt angle, alternating between the first and second series. The left part of each panel represents the first tilt series, the right part the second one. Within each part the tilt angle increases from negative to positive angles with increasing image number. (a) – (e) are the alignment stages listed in Table 1.
