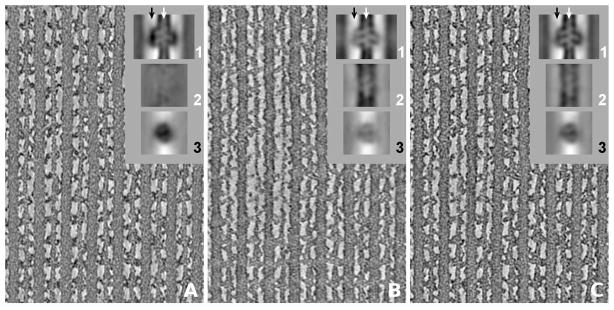
Figure 4.

Central slices through tomograms of insect flight muscle. The thick and thin filaments run vertically. (A) Tomogram computed only from images where the tilt axis is oriented perpendicular to the thin and thick filament axes, and (B) only from images where the tilt axis is parallel to the filament axes. (C) Tomogram computed from the complete dual-axis tilt series. The insets (1), (2), and (3) are global averages of the maps. (1) shows the average in the same orientation as the larger panel with the raw tomogram section; (2) and (3) are sections of the average perpendicular to (1) at the locations indicated by arrows. (2) has the thin filament axis in common with (1) (white arrow), (3) a line midway between thick and thin filaments (black arrow), where the cross-bridges are located. Due to the missing wedge orientation, as explained in the text, helical features of the thin filament are not well rendered and appear with almost no contrast in (A2) whereas crossbridges exhibit high density in (A3). The situation is reversed for (B). For visualization, the contrast was scaled in the same way for all sections.
