Figure 6.

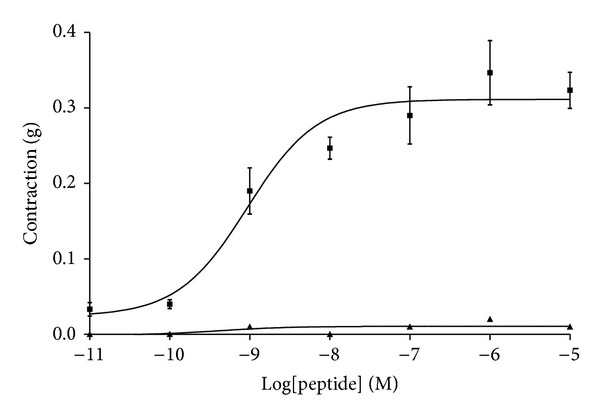
Dose-response curves of sauvatide (■) and balteatide (▲) on rat bladder smooth muscle preparations. Each point represents the mean and standard error of six determinations.

Dose-response curves of sauvatide (■) and balteatide (▲) on rat bladder smooth muscle preparations. Each point represents the mean and standard error of six determinations.