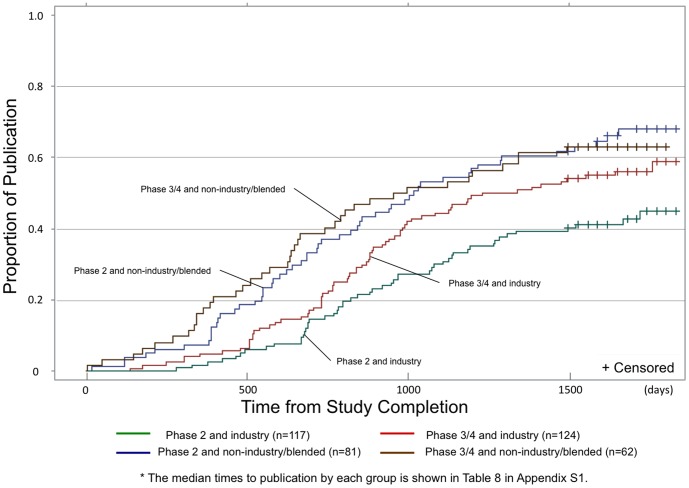
Figure 3. Effect of funding and study phase on proportion of studies that published their primary outcomes in a peer-review journal listed in PubMed by time since study completion.
This X axis indicates days from study completion and Y axis indicates proportion of studies that had publication in a peer-review journal. - Green line shows phase 2 and industry studies. - Blue line shows phase 2 and non-industry/blended studies. - Red line shows phase 3/4 and industry studies. - Brown line shows phase 3/4 and non-industry/blended studies. * The median times to publication by each group is shown in Table S5 in Appendix S1.

