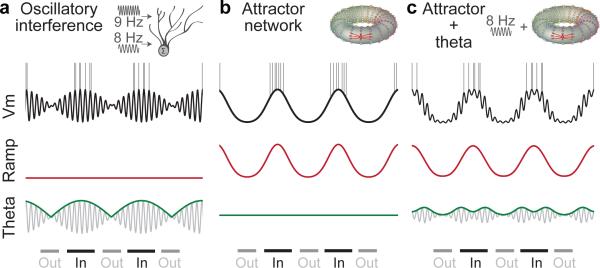
Figure 1. Schematics of membrane potential predicted by different model families, decomposed into low-frequency ‘ramp’ component (red) and a theta frequency component (grey, envelope in green) during in-field (‘In’) and out-of-field periods (‘Out’).
a, Oscillatory interference models. Fields form when theta envelope exceeds threshold; spikes occur on peaks of theta cycles.
b, Attractor network models. Fields form when ramps exceed threshold, without precise spike timing (attractor schematic reproduced from3).
c, Attractor with theta-oscillatory input17. Fields form when ramps are high and spikes occur on peaks of theta oscillations that also drive the attractor.

