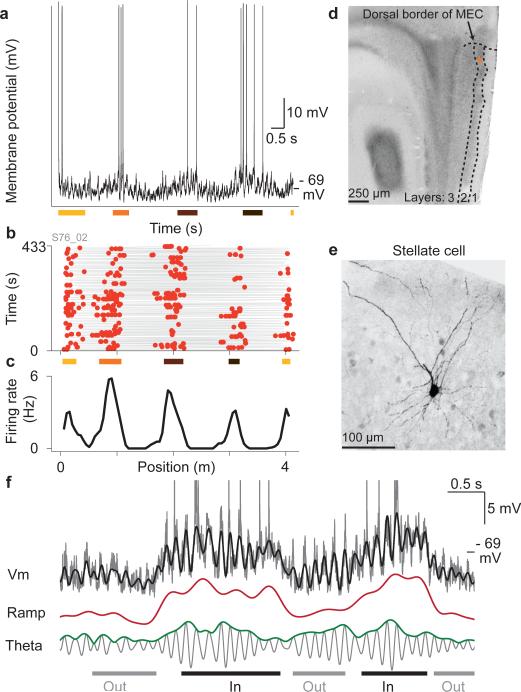
Figure 3. Whole-cell recordings from grid cells.
a, Membrane potential vs. time during a complete run along the virtual track; colored bars indicate grid fields.
b, Trajectory and spikes vs. position; colored bars indicate the same fields as in (a).
c, Firing rate.
d, Soma location (orange dot) in layer 2 of MEC.
e, Stellate morphology.
f, The membrane potential (grey, spikes truncated) could be decomposed into ramp (red) and theta components (grey) and was closely approximated by their sum (black overlay).

