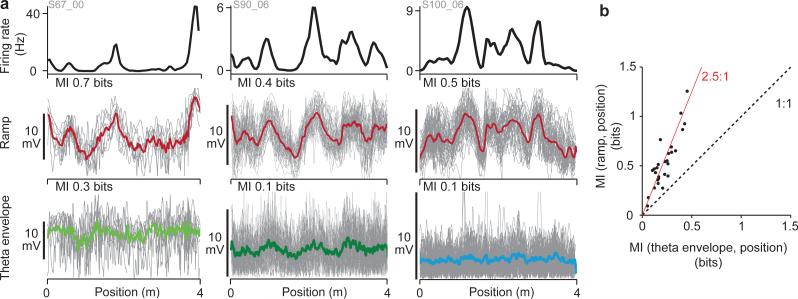
Figure 5. Ramps contain more information about position.
a, Three examples of the firing rate (top), ramp (individual runs, grey; mean, red) and theta envelope (individual runs, grey; mean, green or blue; left: large theta, middle: layer 2 small theta, right: layer 3). Ramps show greater run- to-run reproducibility than theta envelopes.
b, Mutual information (MI) between ramp or theta envelope and position along the track. Information in ramps is always greater than in theta envelope (mean ratio = 2.5).

