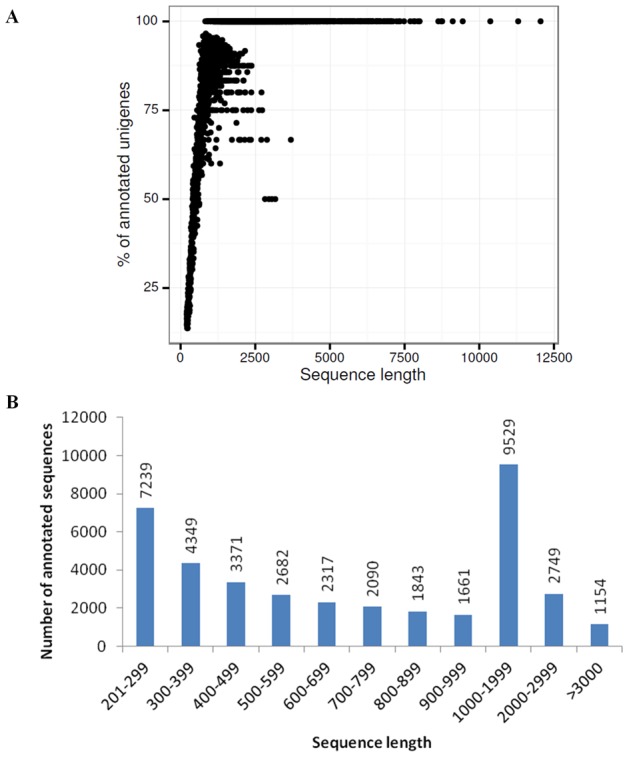
Figure 3. Size distribution of the annotated transcripts.

(A) Relationship between the sequence length of the assembled unigenes and the percentage of annotations in the NCBI nr protein database. (B) Number of annotated unigenes for each size class. The lengths are indicated in base pairs.
