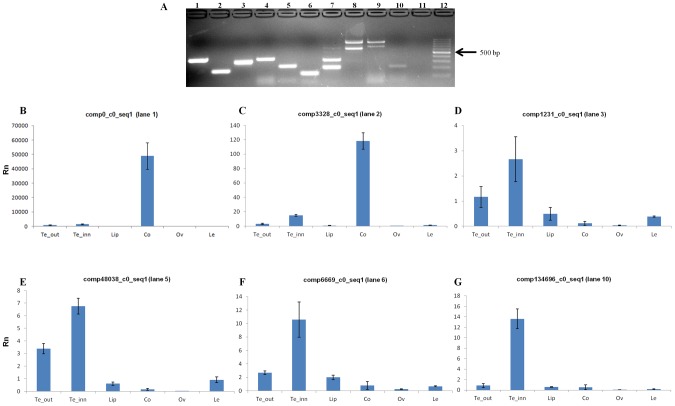
Figure 8. Selected putative long non-coding RNAs expressed in the inflorescence of O. italica.
(A) Agarose gel electrophoresis of the RT-PCR-amplified products of the selected transcripts. Lane 1, comp0_c0_seq1; lane 2, comp3328_c0_seq1; lane 3, comp1231_c0_seq1; lane 4, comp3311_c0_seq1; lane 5, comp48038_c0_seq1; lane 6, comp6669_c0_seq1; lane 7, comp4129_c0_seq1; lane 8, comp1308_c0_seq1; lane 9, comp15481_c0_seq1; lane 10, comp134696_c0_seq1; lane 11, empty; lane 12, 100 bp ladder. (B–G) Relative expression level (Rn) in the outer tepals (Te_out), inner tepals (Te_inn), labellum (Lip), column (Co), ovary (Ov) and leaf (Le) of the transcripts comp0_c0_seq1 (B), comp3328_c0_seq1 (C), comp1231_c0_seq1 (D), comp48038_c0_seq1 (E), comp6669_c0_seq1, (F), and comp134696_c0_seq1 (G). The bars indicate the standard deviation.

