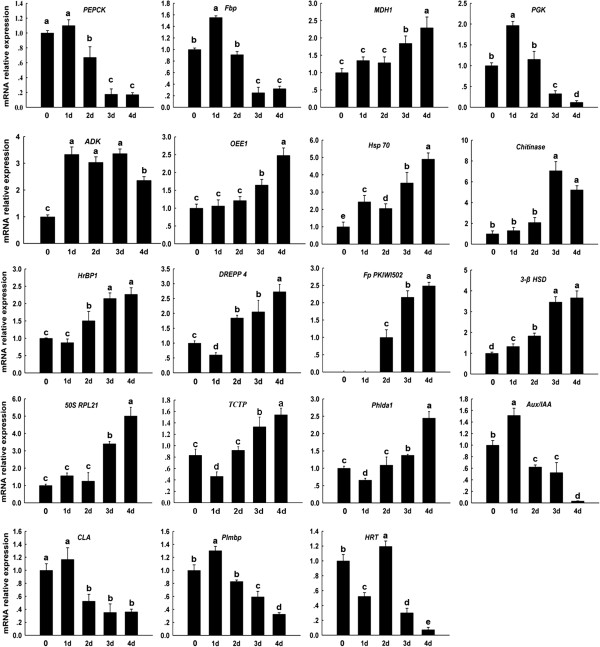
Figure 4.

Quantitative real-time PCR analysis of the mRNA expression levels of differentially expressed proteins under flooding treatment for 0, 1, 2, 3, 4 d. PEPCK: phosphoenolpyruvate carboxykinase; Fbp: fructose-1,6-bisphosphatase; MDH1: malate dehydrogenase 1; PGK: phosphoglycerate kinase; ADK: adenosine kinase; OEE1: oxygen-evolving enhancer protein 1; Hsp 70: heat shock protein 70; Chitinase:Chitinase; HrBP1: Harpin binding protein 1; DREPP 4: DREPP 4 protein; Fp PKIWI 502: fruit protein PKIWI 502; 3-β HSD: 3-beta hydroxysteroid dehydrogenase/isomerase family protein; 50S RPL21:50S ribosomal protein L21; TCTP: translationlly-controlled tumor protein; Phlda: pleckstrin homology domain containing, family A; AUX/IAA: AUX/IAA protein; CLA: control leaf angle; Plmbp: PISTILLATA like MADS box protein; HRT: HRT transcription factor; Data are displayed as mean values ± SD from three independent experiments. The same letter indicated no significant difference, and different letters indicated significant differences, as determined by Fisher’s protected LSD test (p < 0.05).
