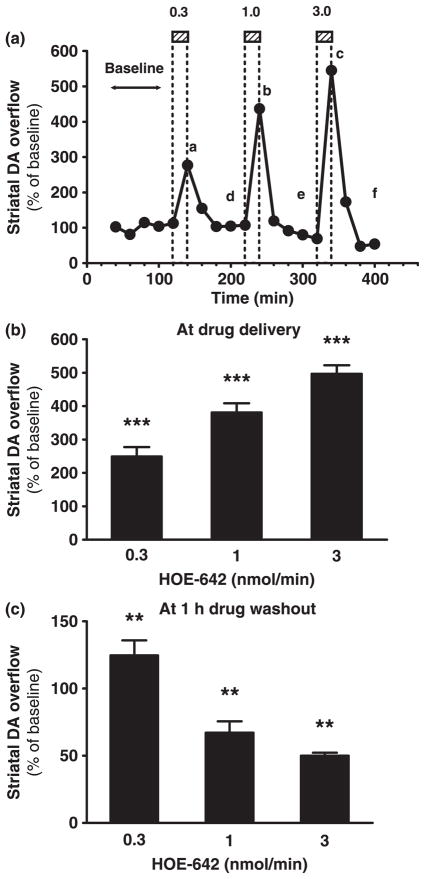
Fig. 1.
Effects of microdialysis delivery of HOE-642 on striatal DA overflow. (a) Striatal DA overflow in 20-min intervals throughout reverse microdialysis of HOE-642 in one representative experiment. DA levels are expressed as percentage of pre-drug baseline levels (y-axis). The microdialysis probe was perfused with 0.3, 1, or 3 nmol HOE-642/min in successive 20-min periods as shown in the hatched boxes (a, b, and c) followed by drug washout intervals (aCSF perfusion only) of at least 1 h (d, e, and f). (b and c) Bar graphs showing striatal DA overflow (mean ± SEM, n = 3) during each of the 20-min delivery periods of HOE-642 or at 1 h washout time-points after HOE-642 delivery (points a–c or d–f, respectively, illustrated in a). ***p < 0.001 and **p < 0.01 denote overall treatment effects (repeated measures one-way ANOVA and test for a linear trend).

