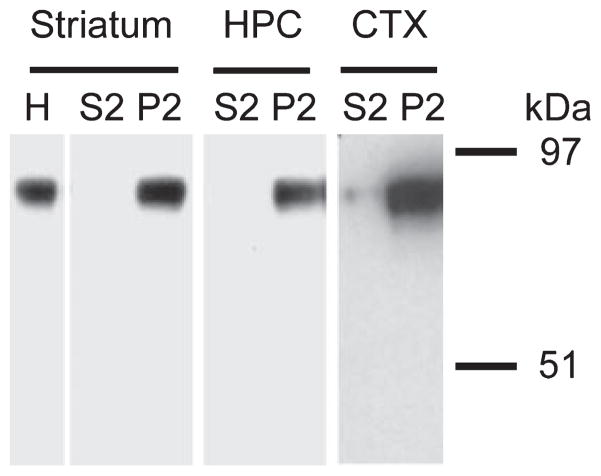
Fig. 5.
Western blot characterization of NHE1 protein in the mouse striatum. Subcellular fractions with cytosolic content (S2) and synaptosomes (P2) were prepared from mouse striatum, hippocampus (HPC), and cortex (CTX). Proteins were resolved by 10% SDS–PAGE and detected by western blotting with the anti-NHE1 antibody XB-17 (1 : 1000). The blot shown for striatal samples is representative of three separate experiments (n = 3). A similar band pattern was found in HPC and CTX samples from two separate control experiments. Molecular weight markers are shown on the right.

