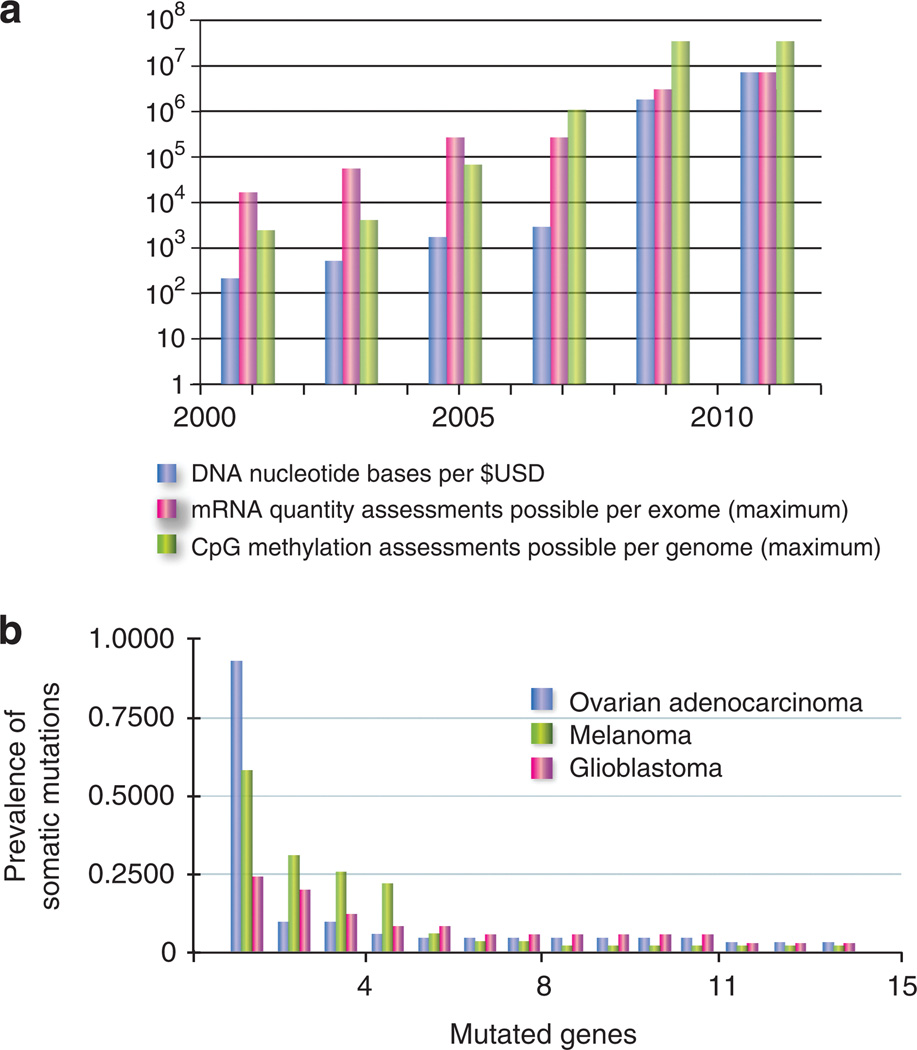
Figure 2. Rapidly expanding sequence profiles of cancer.
(a) For DNA, graph depicts the number of sequenced nucleotides per $1 USD (NHGRI 2011 data sheet, www.genome.gov/sequencingcosts/). For gene expression quantification, the number of discrete assessments across all coding regions is graphed. From 2001 to 2005, the standard Affymetrix (Santa Clara, CA) platform primarily assessed expression at the 3′ ends of transcripts, reaching a maximum of B50,000 transcripts and variants per array. By 2005, so-called ‘‘exon arrays’’ were introduced, carrying probes for each individual exon, interrogating expression of more than 250,000 exons. From 2009 to present, RNA quantification has increasingly been performed using sequencing (RNAseq), approximating all >6 million coding nucleotides in the human genome. For cytosine phosphate guanine (CpG) methylation, the primary advances represent new technologies making denser assessment feasible. Individual platforms, techniques, and genomic CpG coverage are reviewed in Laird (2010) and Fouse et al. (2010). (b) Histogram of genetic heterogeneity in cancer. On the basis of recent sequencing studies, for each cancer type, a histogram of the most commonly mutated genes are arrayed from most to least frequent (The Cancer Genome Atlas Research Network, 2008, 2011; Wei et al., 2011). All non-synonymous mutations per gene were binned; copy number changes are not displayed.

