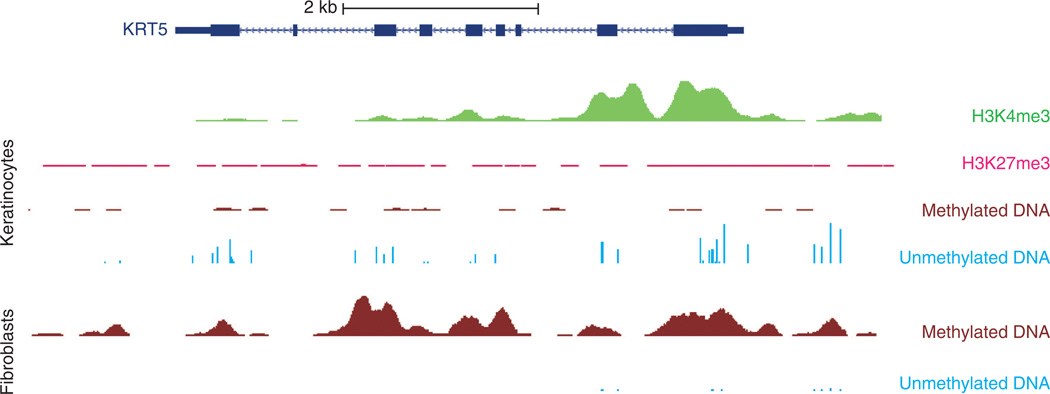
Figure 4. Histone modification and DNA methylation profile of keratin 5 (KRT5).
University of California, Santa Cruz (UCSC) genome browser snapshot encompassing an ~9 Kb segment of DNA spanning the KRT5 locus. The dark blue rectangles and lines depict the KRT5 gene structure. Profiled cells are primary cultured neonatal foreskin keratinocytes (KCs, top) and fibroblasts (bottom). These KCs express KRT5, whereas fibroblasts do not. Starting from the top, there are high levels of H3K4me3 histone modification signal (associated with active promoters) at the promoter in KCs (depicted in green). In pink, H3K27me3 signal (associated with gene repression) shows low levels in KCs. Depicted in brown are regions of methylated DNA (assessed by methylated DNA immunoprecipitation sequencing), with minimal signal in KCs and high levels in fibroblasts. Unmethylated DNA (assessed by methylation-sensitive restriction enzyme sequencing) is depicted with light blue vertical bars and shows a high number of sequencing peaks for KCs compared with a low number for fibroblasts. These data and other reference epigenomes are publicly available from the NIH Roadmap Epigenome Project website (http://vizhub.wustl.edu; Zhou et al., 2011b).

