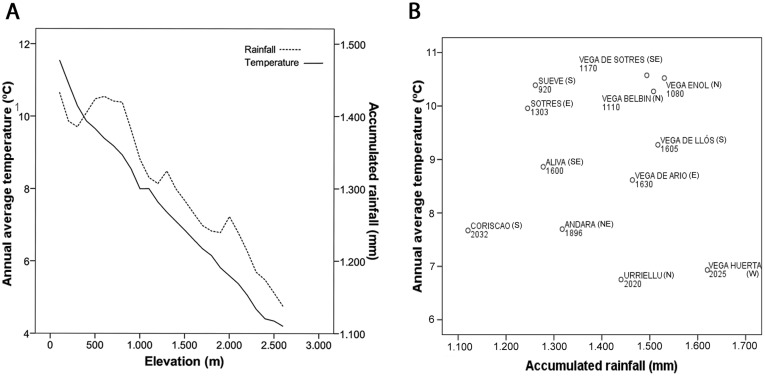
Figure 2. Climate of the Study area and localities.
(A) Graphical representation of the average annual temperature (°C; solid line) and accumulated rainfall (millimeters/year; dotted line) along the elevational gradient in our study area. (B) Annual average temperature and annual accumulated rainfall of each sampling locality, and the associated elevation (m.a.s.l.). The slope exposition is also shown (N = North, S = South, E = East, W = West).

