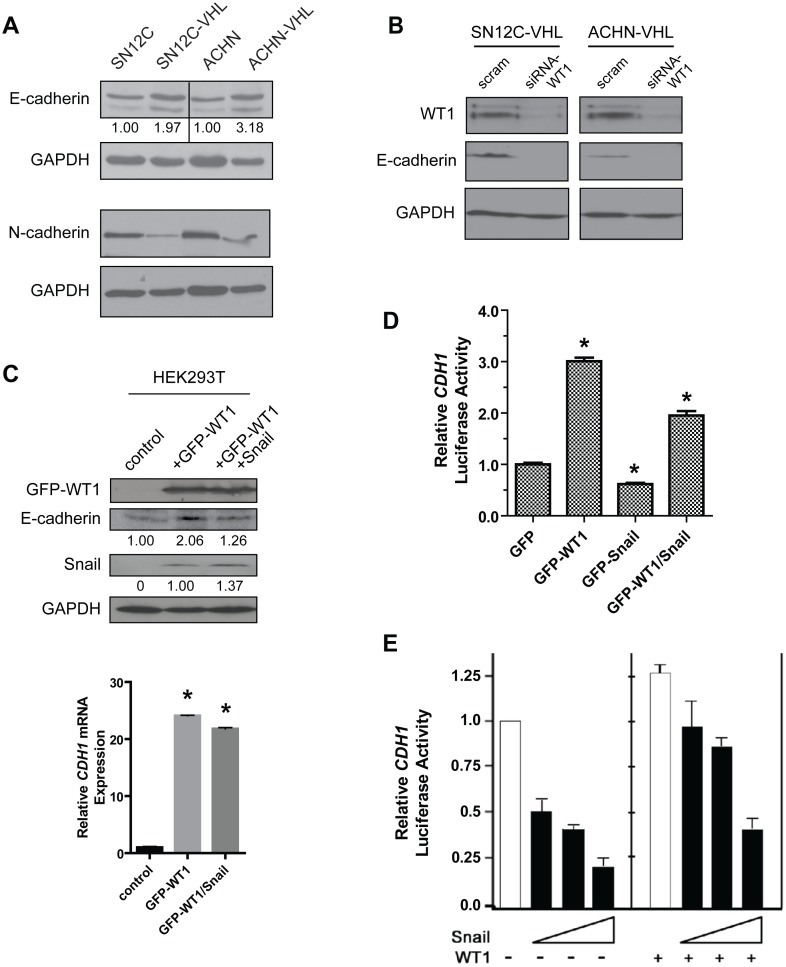
Figure 4. WT1 upregulates E-cadherin expression in the presences of Snail.
(A) Immunoblot analysis of E-cadherin and N-cadherin expression in the isogenic SN12C and ACHN cell lines. (B) VHL-knockdown RCC cells were transfected with scrambled or WT1-specifc siRNAs and E-cadherin expression was assessed by immunoblot. (C) Top, HEK293T cells were transfected as indicated and protein expression was assessed by immunoblot. Bottom, analysis of E-cadherin mRNA levels. (D, E) HEK293T (D) or MDCK (E) cells were cotransfected with the indicated plasmids and the CDH1 promoter reporter construct, and luciferase activity was measured. Graphs represent mean±SD of one representative experiment. *, P<0.05.

