
Figure 4.
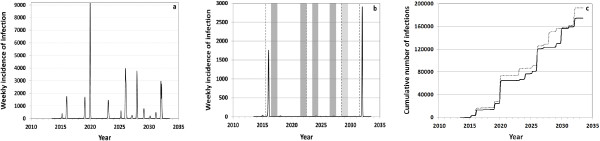
Results of a randomly selected simulation. (a) Weekly influenza infection incidence (all strains and lineages) in the TIV scenario. (b) Weekly incidence of B/Yam infections only; years in which B/Yam is not contained in TIV have a dark grey background; the introduction of new drift variants is shown by dashed vertical lines; in 2028, the vaccine is mismatched to the newly introduced drift variant (light grey background). (c) Cumulative number of all influenza infections which occur in the TIV scenario (dashed) and in the QIV scenario (solid line). All three graphs relate to the same simulation.