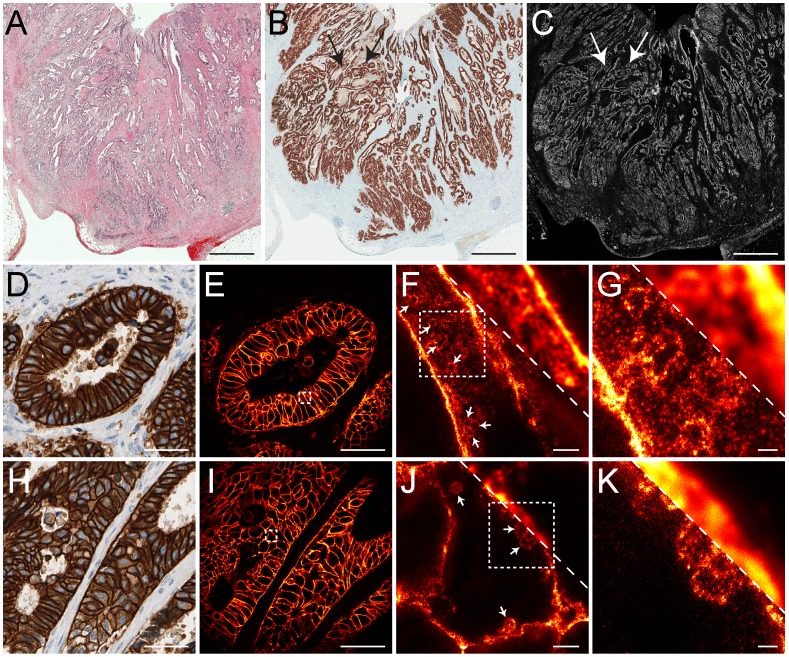
Figure 3. Comparison of (A) Hematoxylin-Eosin-, (B) immunohistochemistry-, and (C) immunofluorescence-labeling on three consecutive 2 µm thick tissue sections of a HER2 positive paraffin-embedded human rectal cancer.
Note that the three consecutive sections cover the same region in the tissue. The images were taken with diffraction-limited widefield (A,B) or confocal (C) microscopy. (D,H) and (E,I): corresponding magnifications out of (B) and (C), respectively, at sites indicated by the arrows. (F,G,J,K): comparison of diffraction-limited confocal microscopy with STED super-resolution microscopy on sectioned stored tumor tissue. Shown are magnifications of the areas indicated by the dashed squares. Top-right corners: confocal imaging. Left-bottom area: STED imaging. The arrows point to HER2-positive vesicle-like structures that are resolved in the STED images. Scale bars: 1 mm (A–C), 50 µm (D,E,H,I), 2 µm (F,J), and 500 nm (G,K).

