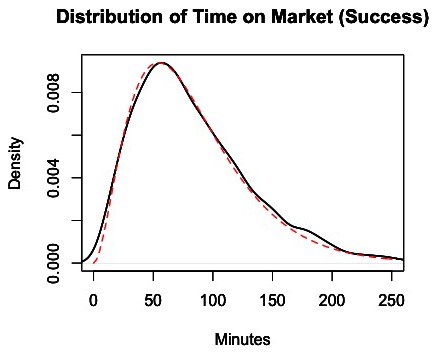
Figure 4. Distribution of time in the market, conditional on successfully obtaining heroin.

The black line represents the density of the amount of time each customer spent in the market for individual successful market trips based on 100 simulations of the market from days 180 to 365. The dashed red line represents a fitted distribution, which is a Gamma (2.9,0.035) distribution.
