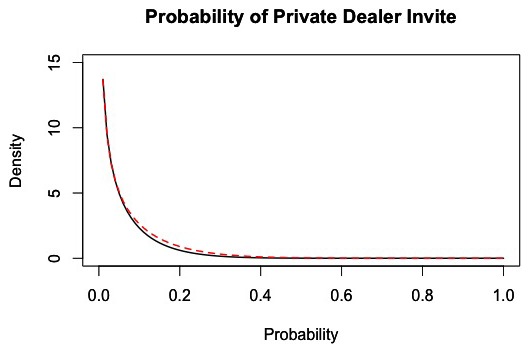
Figure 7. Distribution of the probability of being invited to purchase from a private dealer, conditional on successfully purchasing heroin via a street broker.

The black line represents the density of the invite probability across all customers within each 1-hour interval of market activity based on 100 simulations of the market from days 180 to 365. The dashed red line represents a fitted distribution, which is a Beta (0.55,7.45) distribution.
