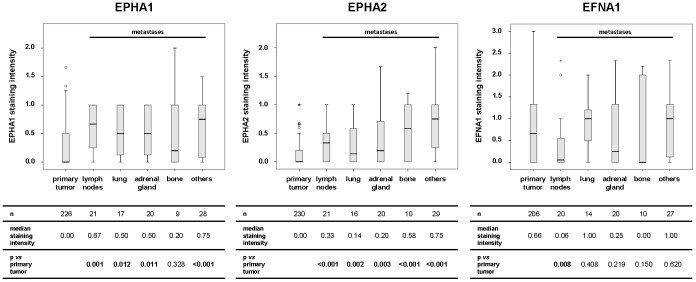
Figure 2. Differential protein expression of EPHA1, EPHA2 and EFNA1 in primary tumors and subgroups of metastases.
The table beneath each image includes the number of patients and the median staining intensity for each group as well as the p values retrieved by the Mann–Whitney U test. P values highlighted in bold indicate statistically significant differences following corrections for multiple comparisons (n = 5 for each protein) by using the method of Benjamini and Hochberg.

