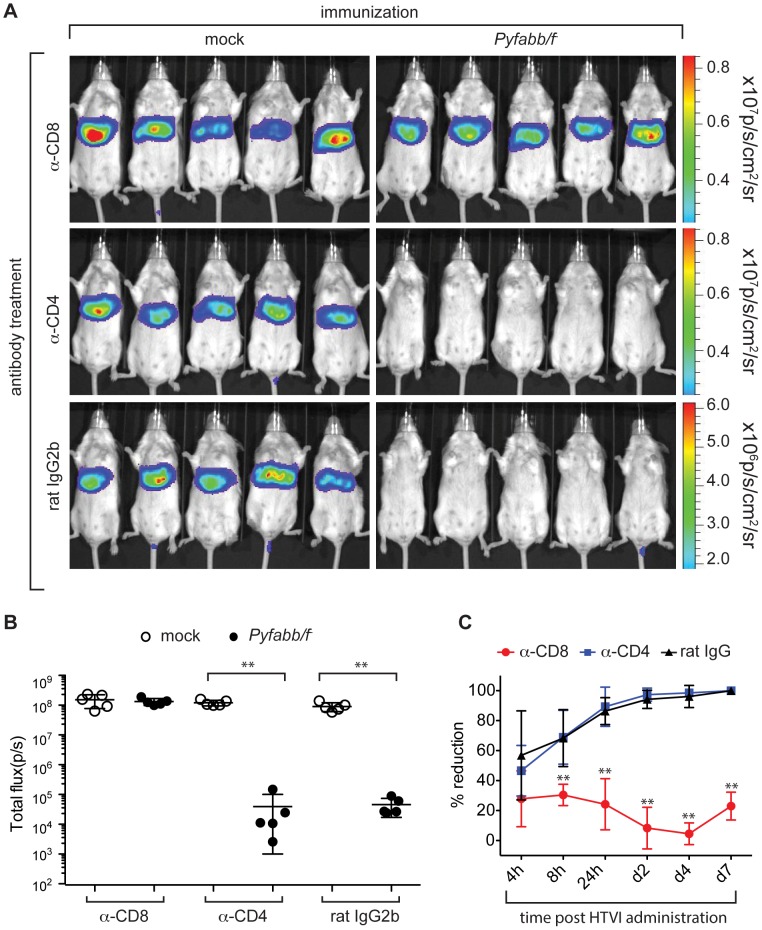
Figure 2. Elimination of hepatocytes that express PyCSP-Luc is mediated by CD8+ cells.
(A) Luciferase signal in live mice immunized twice with 50,000 Pyfabb/f− salivary gland sporozoites (right panel) or mock immunized (left panel) with salivary gland debris, and treated 14 days later for two consecutive days with antibodies anti-CD8 (top panel), anti-CD4 (middle panels) or an equivalent amount of control rat IgG2b, before HTVI challenge with 25 µg of phCMV-PyCSP-Luc and imaged 7 d post challenge as described. Each group contained 5 mice. The scale indicates radiance expressed as p/s/cm2/sr. (B) Quantitation of the data shown in part A. Radiance is shown as total flux (p/s). The data represents 5 individually analyzed mice in each group and correspond to mean ± SD; significant differences between the mean of the mock vs. Pyfabb/f−-immunized mice for each treatment calculated using the Mann-Whitney test are indicated (** = p<0.01). (C) Kinetics of inhibition of luciferase expression upon depletion of CD8+ (red circles) or CD4+ (blue squares) T cells, or mock depletion (black triangles), calculated as percentage reduction compared to the mock immunization control for each condition. The data represents 5 individually analyzed mice in each group, and correspond to mean ± SD; significant differences between the CD8 or CD4 T cell depletion vs. the mock depletion are indicated (** = p<0.01).

