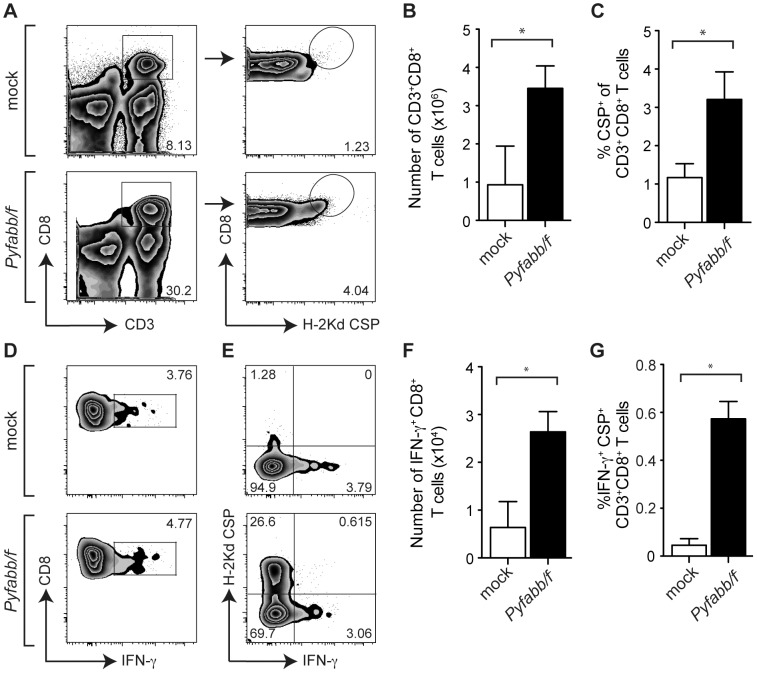
Figure 3. PyCSP-specific CD8+ T cells produce high levels of IFN-γ.
(A) Characterization of infiltrating liver lymphocytes isolated from mice immunized with Pyfabb/f − sporozoites (bottom panel) or mock-immunized (top panel) 7 days after HTVI challenge with plasmid DNA encoding for PyCSP-Luc. Representative dot plots gated on live lymphocytes showing CD8+ versus CD3+ (left panel) and CD8+ versus H-2Kd CSP tetramer (left panel) expression (B) Absolute number of CD8+ T cells in mock-immunized mice and in mice immunized with Pyfabb/f − sporozoites. (C) Percentage of CSP-specific CD8+ T cells in mock-immunized mice and in mice immunized with Pyfabb/f − sporozoites. (D) Characterization of IFN-γ producing liver CD8+ T cells in mice immunized with Pyfabb/f − sporozoites (bottom panel) or mock-immunized (top panel) as determined by intracellular cytokine staining. Representative dot plots gated on live CD3+ lymphocytes showing CD8+ versus IFN-γ expression. (E) Representative dot plot gated on live CD3+ CD8+ T cells showing H-2Kd-CSP versus IFN-γ expression. (F) Absolute number of IFN-γ+ CD8+ T cells in in mock-immunized mice and in immunized with Pyfabb/f − sporozoites. (G) Percentage of CSP-specific CD8+ T cells producing IFN-γ in mock-immunized mice and in mice immunized with Pyfabb/f − sporozoites. (B–C and F–G) The data represents 3–5 individually analyzed mice in each group, and correspond to mean ± SD; significant differences between the mean of the mock vs. Pyfabb/f −-immunized mice calculated using the Mann-Whitney test are indicated (* = p<0.05).

