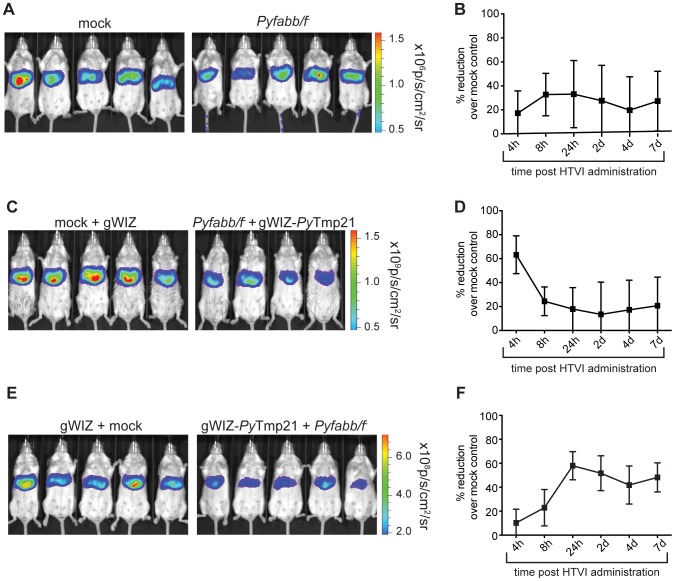
Figure 5. PyTmp21 contributes to the protective immune response elicited by GAP vaccines.
(A) Quantification of luciferase signal (shown as total flux p per second) in mice immunized twice with 50,000 Pyfabb/f− salivary gland sporozoites (right panel) or mock-immunized with salivary gland debris (left panel), challenged by HTVI with 25 µg of phCMV-PyTmp21-Luc 30 days after the last immunization. Each group contained 5 mice. (B) Inhibition of luciferase signal over the course of the experiment calculated as percentage reduction vs. the mock-immunization control. The data represents 5 individually analyzed mice in each group and correspond to mean ± SD. (C) Quantification of luciferase signal (shown as total flux p per second) in mice primed with 50,000 Pyfabb/f− salivary gland sporozoites and boosted with gWIZ-PyTmp21 (right panel), or mock-immunized and injected with gWIZ (left panel), challenged as described in part A. Each group contained 4 to 5 mice. (D) Inhibition of luciferase signal over the course of the experiment calculated as percentage reduction vs. the mock-immunization control. The data represents 5 individually analyzed mice in each group and correspond to mean ± SD. (E) Quantification of luciferase signal (shown as total flux p per second) in mice primed with gWIZ-PyTmp21 and boosted with 50,000 Pyfabb/f− salivary gland sporozoites (right panel), or injected with gWIZ and mock-immunized (left panel), challenged as described in part A. Each group contained 5 mice. (F) Inhibition of luciferase signal over the course of the experiment calculated as percentage reduction vs. the mock-immunization control. The data represents 5 individually analyzed mice in each group and correspond to mean ± SD.

