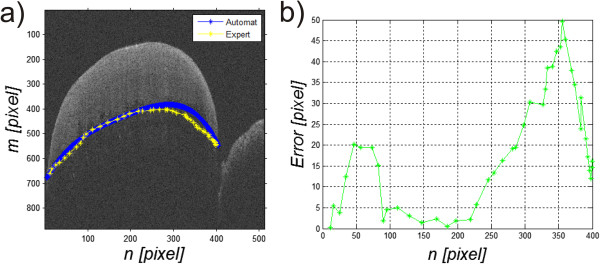
Figure 11.

The next steps of detecting the enamel boundary in tomographic images of teeth. Figure a) shows contours of the enamel boundary marked by an expert and automatically. Figure b) shows the graph of errors for each image column as the relative difference between manual indication of the enamel boundary by an expert and the result of the algorithm automatic operation.
