
Figure 12.
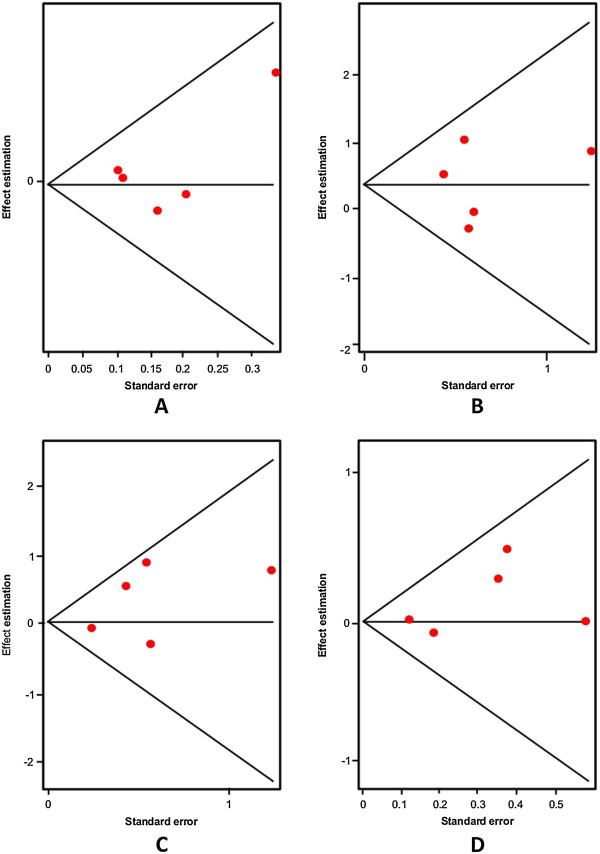
Egger's funnel plots indicating publication bias in studies on suicidal behavior and the G19918A TPH-2 variant without heterogeneity, using the following models: A) Allelic; B) Additive; C) Dominant, and D) Recessive.
Official websites use .gov
A
.gov website belongs to an official
government organization in the United States.
Secure .gov websites use HTTPS
A lock (
) or https:// means you've safely
connected to the .gov website. Share sensitive
information only on official, secure websites.
Egger's funnel plots indicating publication bias in studies on suicidal behavior and the G19918A TPH-2 variant without heterogeneity, using the following models: A) Allelic; B) Additive; C) Dominant, and D) Recessive.