Figure 8.

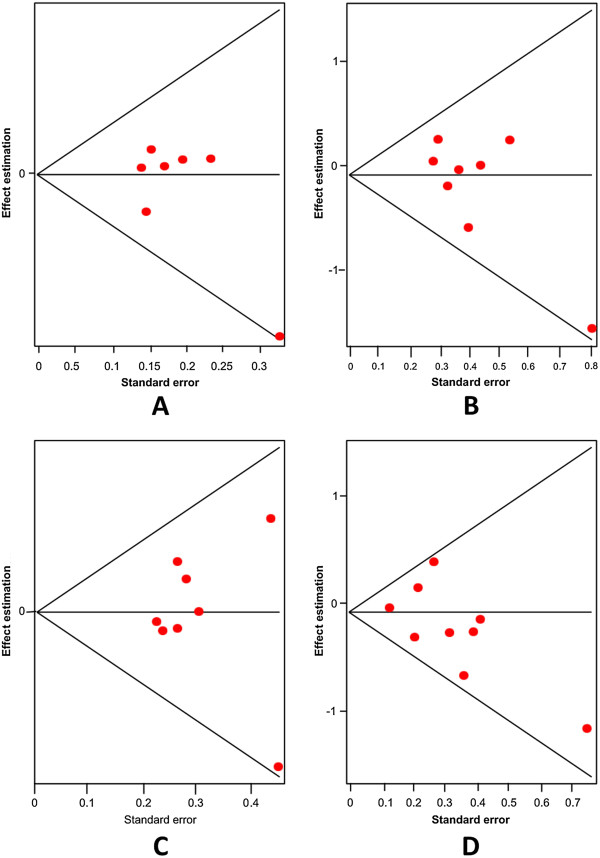
Egger's funnel plots indicating publication bias in studies on suicidal behavior and the G-703 T TPH-2 variant without heterogeneity, using the following models: A) Allelic; B) Additive; C) Dominant, and D) Recessive.

Egger's funnel plots indicating publication bias in studies on suicidal behavior and the G-703 T TPH-2 variant without heterogeneity, using the following models: A) Allelic; B) Additive; C) Dominant, and D) Recessive.