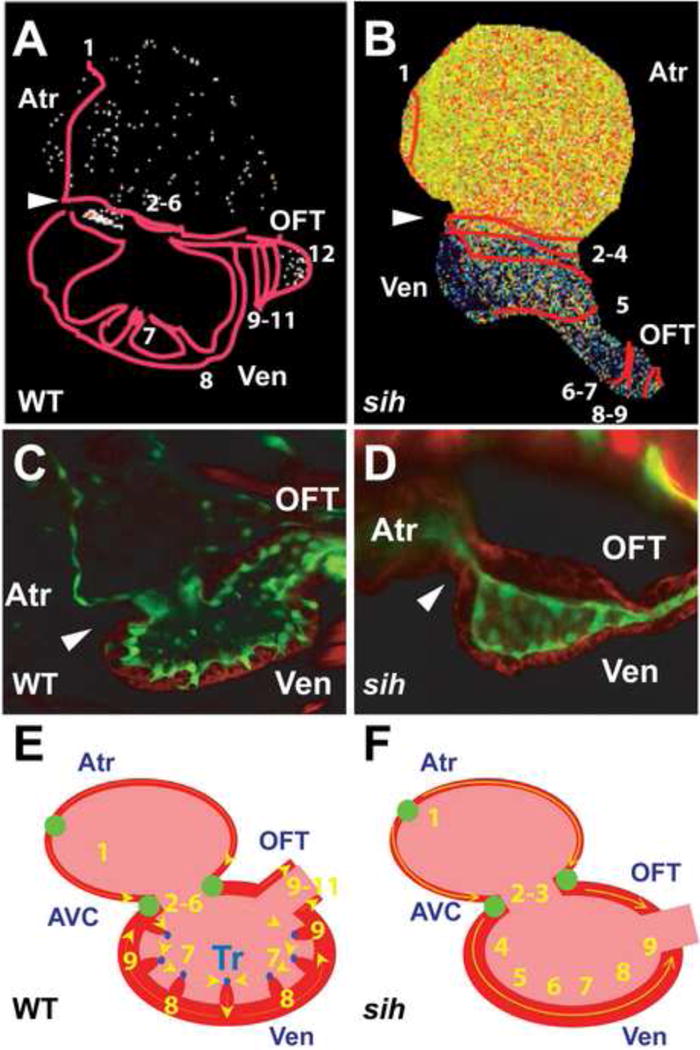
Figure 5.

Cardiac conduction in wildtype (WT) and sih mutant hearts. (A, B) Optical mapping of calcium activation in 100 hpf (A) WT and (B) sih mutant hearts, using Tg(cmlc2:gCaMP). Isochronal lines (numbered red lines) indicate temporal calcium activation every 60 ms from venous to arterial pole. Note that the initial ventricular calcium activation within the WT ventricle begins in the trabeculae, whereas it initiates in the ventricular wall in sih ventricles. (C, D) Confocal images of rhodamine phalloidin stainied Tg(flk1:EGFP) (C) WT and (D) sih hearts. Green: endocardial cells; Red: cardiomyocytes; White arrowhead: AV canal. Though both WT and sih hearts have completed cardiac looping, trabeculae has formed only in WT hearts. (E, F) Schematic representation of WT and sih hearts as seen in (A, B). Numbers indicate calcium activation sequence. Yellow arrows show the direction of conduction. Green circles represent slow conduction nodes. Atr: atrium; Ven: ventricle; OFT: outflow track; AVC: AV canal. [11]
