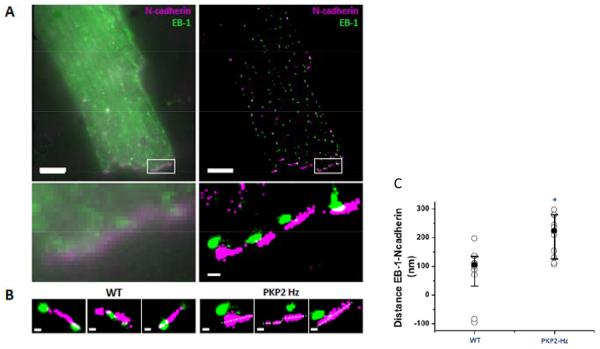
Figure 4.
Localization of EB-1 (green) and N-cadherin (purple) in adult mouse ventricular myocytes. A: Image by TIRF (left) or dSTORM (right). Inset enlarged in bottom panels to show increased resolution. B: Comparison between wild type and PKP2-Hz myocytes: clusters in WT (left) are closer to each other than in PKP2-Hz cells (right). C: Dot plot of distance from EB-1 to N-cadherin showing increased separation between the proteins in the PKP2-Hz cells. Reproduced with permission from Cerrone et al, 2013.

