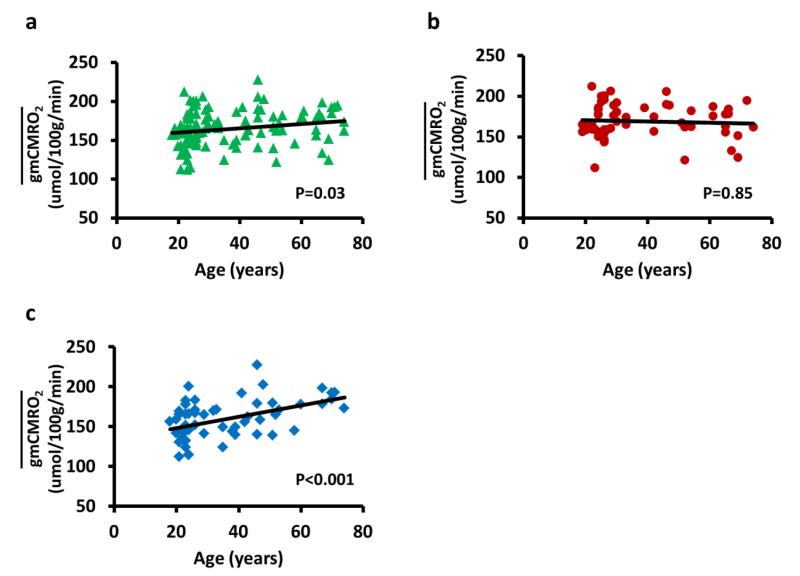
Figure 2.
Scatter plots between and age. (a) Data from all subjects. Each symbol represents data from one subject. Black curve indicates the trend line. showed a significant increase with age (P=0.03). (b) Data from female subjects only. There was not a significant age effect on . (c) Data from male subjects only. Regression analysis showed that increases significantly with age (P<0.001).

