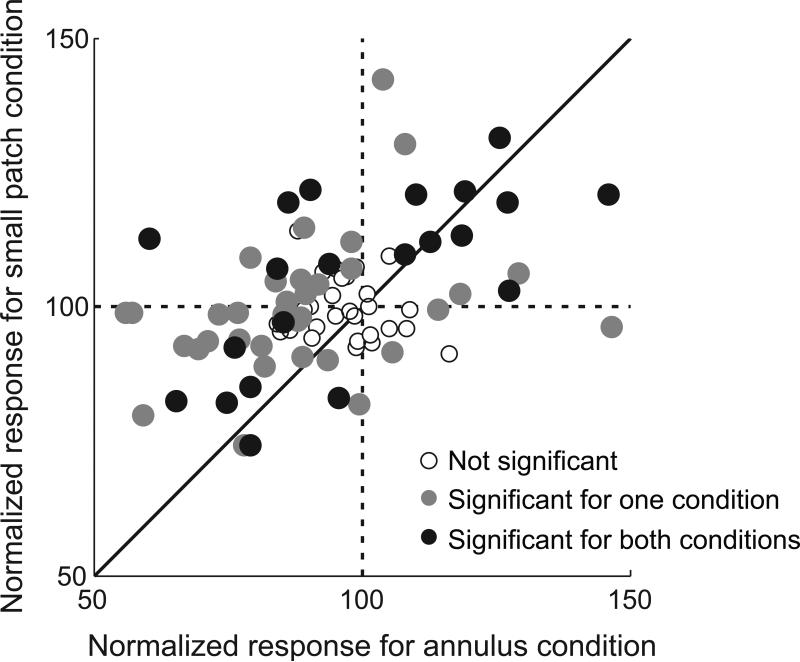
Figure 5.
Modulation strength comparison: annulus vs. small patch pattern. Each circular symbol (N = 92) represents the mean value of normalized responses for four “center + surround” conditions (e.g., 1~4th bar in Figure3B). Abscissa values are for annulus conditions and ordinate levels are for small patch trials. Shading of circles convey statistical significance (two-sided Mann-Whitney U-test (p<0.05)) of center-surround modulation (open circles: not significant for either condition, gray filled: significant for only one condition. black filled: significant for both conditions). Symbols in left half of the graph mean that suppressive modulation is induced by annulus surround pattern. Almost all symbols in left half of the graph are positioned above the diagonal line (55 vs. 9). This means that neural responses to small patch surround patterns are stronger than those for the annulus. This follows because of surround facilitation (in 2nd quadrant, top left) or weakened surround suppression (in 3rd quadrant, bottom left). Symbols in the right half (facilitation cases for the annulus pattern) are positioned mainly in the 1st quadrant (top right), and rarely in the 4th quadrant (bottom right). Within the 1st quadrant, symbols are evenly distributed with respect to the diagonal line (9 vs. 9). This means that surround facilitation induced by the small patch surround can be either weaker or stronger than that caused by the annulus. These results support the idea that suppressive modulation requires stronger surround input than that for facilitation (see details in text).

