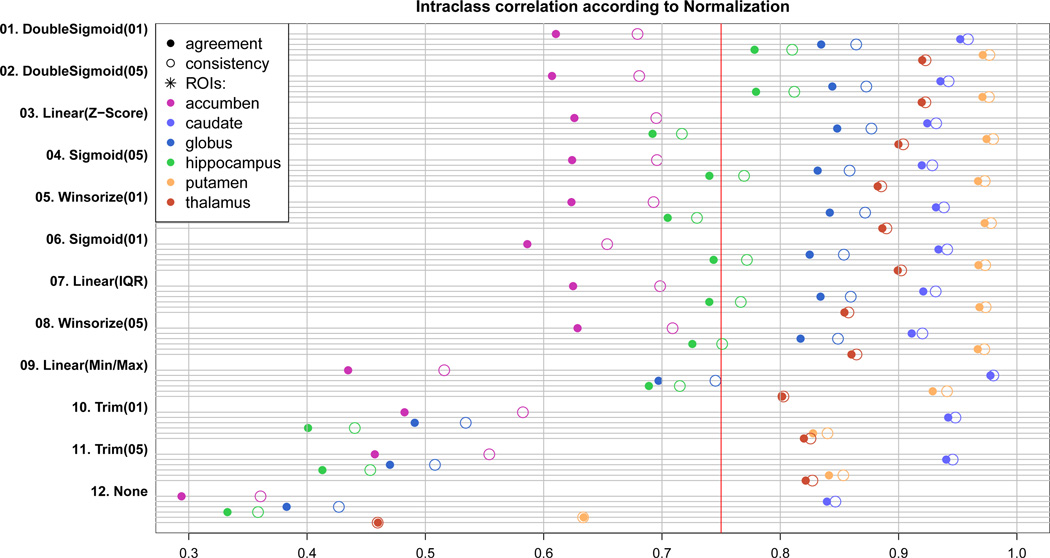
Figure 3.
ICC(A) (solid circle) and ICC(C) (empty circle) is plotted for 11 normalization strategies as well as raw data without normalization (None). Higher ICC means better correspondence of BRAINSCut to manual traces, and thus the greater segmentation accuracy. All six structures are tested and plotted with different colors. The red line is a ICC’s lower bound suggested by Shrout [62]. Experiments are ranked by its average performance over six structures from the top to bottom. One should note that all 11 𝒩f(·)s improved segmentation accuracy of BRAINSCut with statistical significance.

