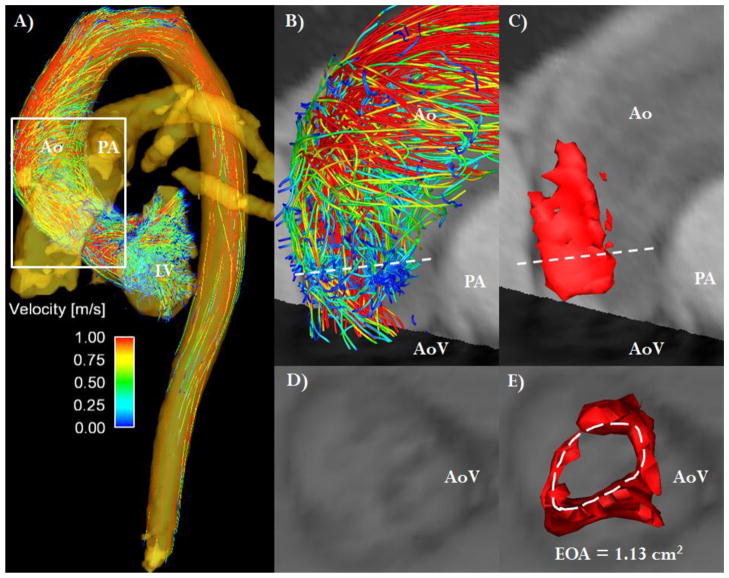
FIGURE 1. 4D flow jet shear layer detection method.
Panel A shows the 3D visualization of aortic flow based on streamlines at peak systole. The white box defines the region of interest for the evaluation of aortic valve stenosis severity. Panel B shows the region of interest with the dashed white line indicating the vena contracta location. Panel C shows the same lateral 3D view of the jet shear layer detection structure used to estimate valve effective orifice area (EOAJSLD-4D). Panel D shows the visualization of valve anatomic opening. Panel E shows the direct visualization and measurement of valve EOA by JSLD method, the dashed white line defines the vena contracta surface (i.e. EOA). Ao: Aorta, AoV: Aortic valve, LV: Left ventricle, PA: Pulmonary artery.

