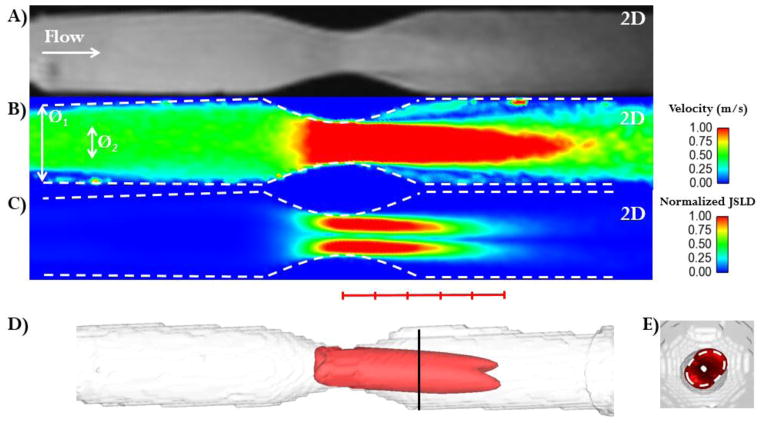
FIGURE 2. In vitro validation.
Panel A: Magnitude image along the stenosis phantom z-axis. The white arrow indicates the primary flow direction. Panel B: Absolute velocity plane (in m/s) along the stenosis phantom z-axis. The white arrows indicates the phantom diameters (Ø1 = 20.4 ± 0.5 mm, stenosis Ø2 = 10 ± 0.5 mm). Panel C: normalized jet shear layer detection (JSLD) along the z-axis of the stenosis phantom. Panel D: 3D structure along the JSLD z-axis which was used to estimate the effective orifice area (EOA). A red line is marked with hash marks to indicate stenosis diameter. Panel E: Axial view of the 3D JSLD structure: the cross-sectional area (white dashed line) corresponds to EOA determined by the JSLD method. The oval orifice shape detected by the JSLD method matched the oval orifice geometry produced during manufacturing with a rapid prototyping printer.

