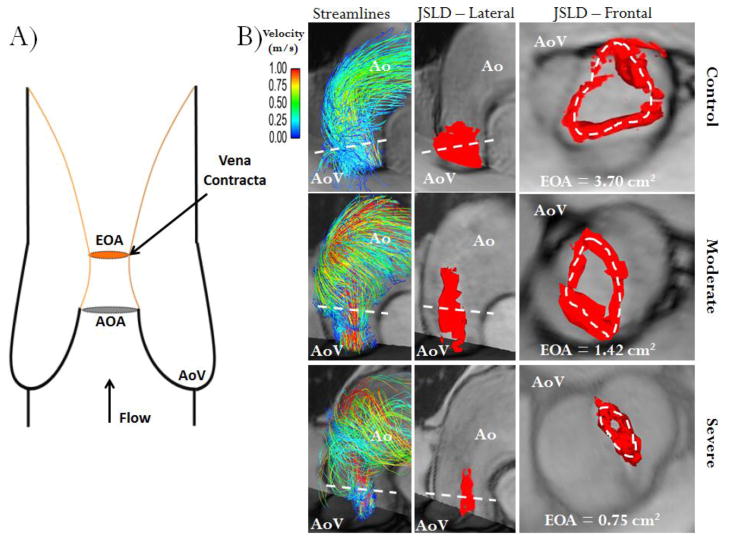
FIGURE 3. Schematic of valve effective orifice area estimation.
Panel A shows an idealized representation of transaortic valve flow separation. AOA is the anatomic orifice area and EOA is the valve effective orifice area at the vena contracta (smaller area of transvalvular flow reattachment, orange lines, and maximal velocity position), note AOA>EOA. Panel B shows three different cases (control, moderate and severe aortic stenosis) using valve area estimation with the 4D flow jet shear layer detection (JSLD) method. The first column illustrates the aortic flow velocity streamlines at peak systole; the second column shows a 3D lateral view of the JSLD structure, with the red iso-surface, computed from 4D flow MRI data at peak systole; the third column shows a 3D frontal view of JSLD at peak systole. The dashed white line indicates transvalvular maximal velocity position, i.e. the vena contracta. Ao: Aorta, AoV: Aortic valve.

