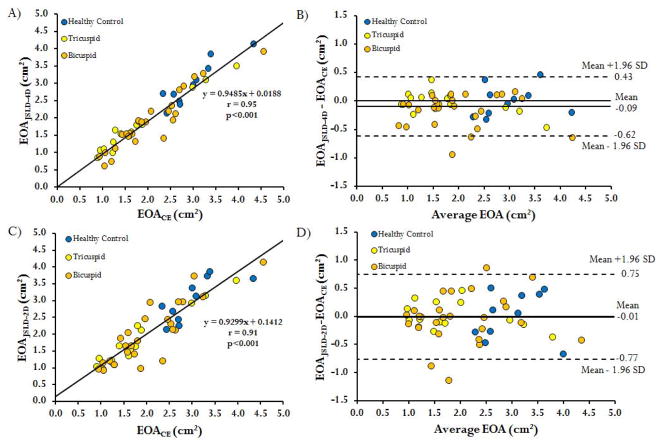
FIGURE 4. Regression and Bland-Altman plots of valve effective orifice area measurement methods.
Panel A shows the regression fit of the valve effective orifice area (EOA) measured by the continuity equation using 2D PC MRI (EOACE) and the 4D flow MRI EOA measured by the jet shear layer detection method (EOAJSLD-4D). Panel B shows the corresponding Bland-Altman agreement plot for both methods. Panel C shows the regression fit of the valve EOA measured by 2D PC MRI jet shear layer detection method (EOAJSLD-2D) and the EOACE. Panel D shows the corresponding Bland-Altman agreement plot for both methods.

