
Figure 2.
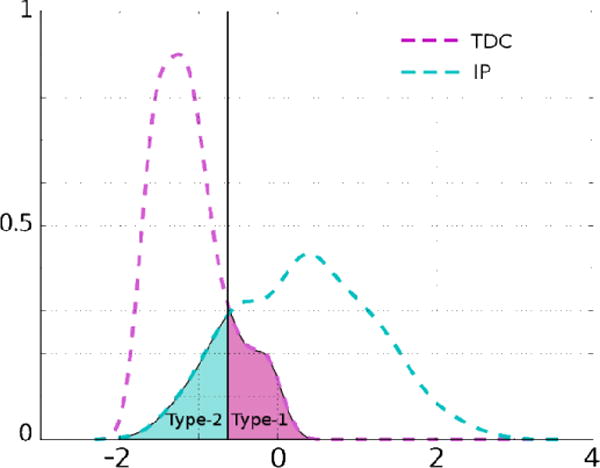
Type-1 and Type-2 errors of classification illustrated by shaded areas under the curves. The solid black line is the threshold for this score to get the best classification performance.
Official websites use .gov
A
.gov website belongs to an official
government organization in the United States.
Secure .gov websites use HTTPS
A lock (
) or https:// means you've safely
connected to the .gov website. Share sensitive
information only on official, secure websites.
Type-1 and Type-2 errors of classification illustrated by shaded areas under the curves. The solid black line is the threshold for this score to get the best classification performance.