
Figure 8.
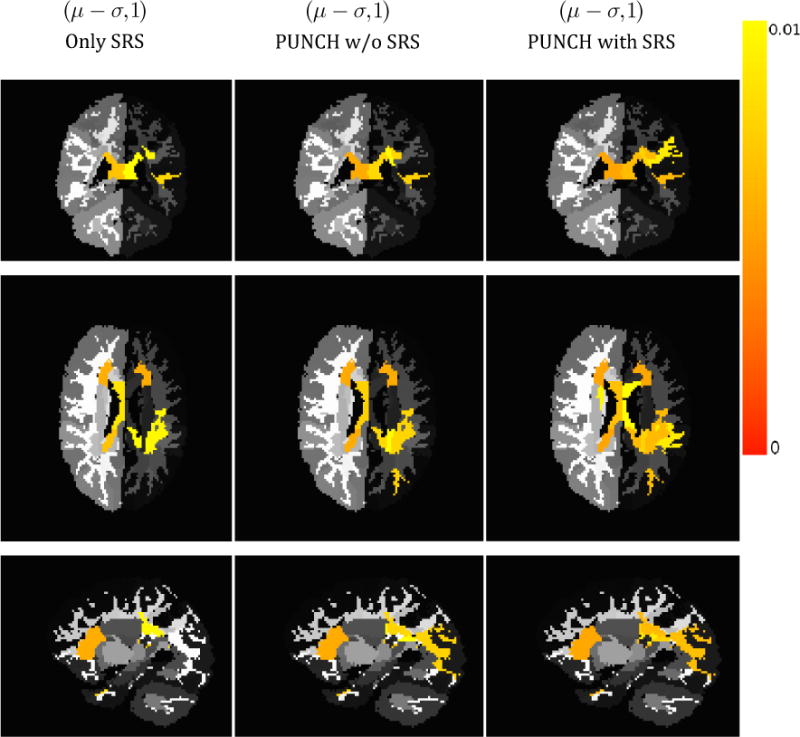
Comparison of significantly affected regions using different severity scores for individuals that are severely affected by ASD. The columns show results when (1) using only SRS, (2) fusing instruments given in Table 1 by PUNCH excluding SRS, and (3) fusing instruments given in Table 1 by PUNCH including SRS. PUNCH assessments reveal more affected regions.