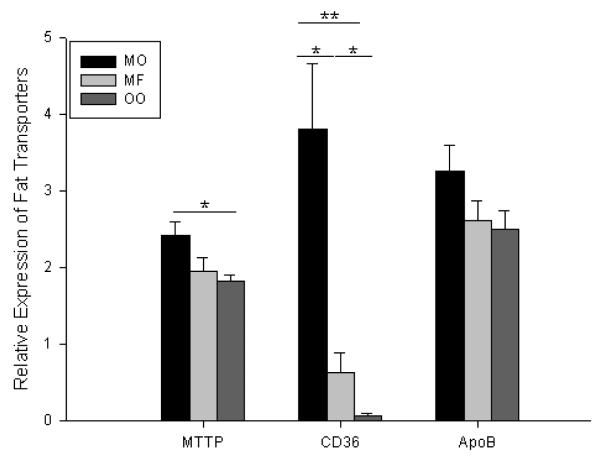
Figure 9.
Fat related mRNA expression of microsomal triglyceride transporter protein (MTTP), CD36, and apolipoprotein B (ApoB) as determined by RT-PCR. β–Actin was used as the endogenous control, and whole bowel was used as a calibrator. MO = Menhaden Oil Diet, MF = Milk Fat Diet, OO = Olive Oil Diet. * p < 0.05, ** p < 0.005

